Your Users Are Drowning in Spreadsheets. You Need a Dashboard.
If you're a product lead shipping analytics features, you know: users don't read CSV exports. They need visual proof your product is working.
We build real-time data visualization dashboards with Next.js, D3, and Recharts -- backed by PostgreSQL, Supabase RLS, and exportable PDF reports.
Data visualization dashboard development is the work of designing and engineering interactive, real-time interfaces that turn raw data into something your team can actually use -- charts, tables, reports. For SaaS analytics, ops, and finance teams, that means secure multi-tenant dashboards with role-based access, live data streams from PostgreSQL or warehouse sources, and PDF exports you can attach to anything. We build these on Next.js with D3.js and Recharts.
What is holding your current website back?
Common gaps we find in nearly every audit.
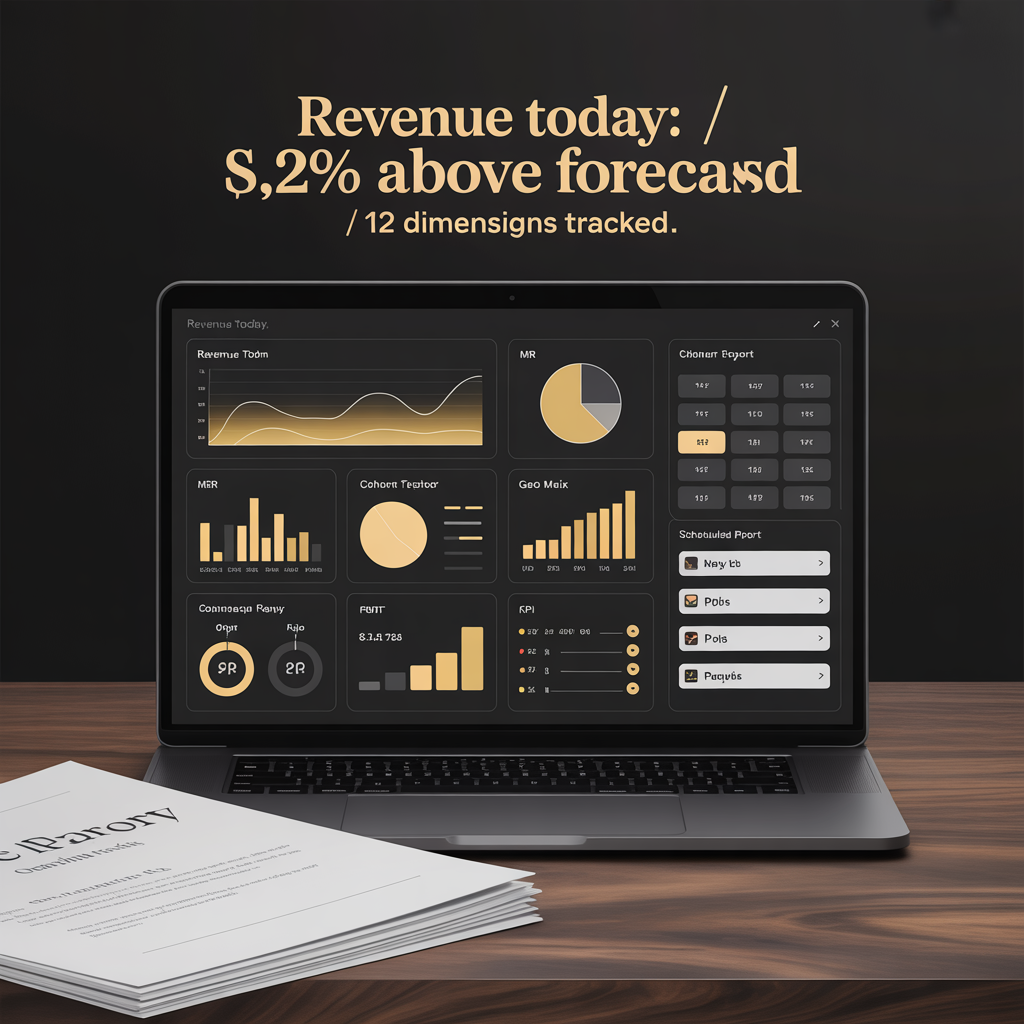
What Your Website Could Look Like
Custom-designed for your industry. No templates. No stock photos.
How We Build This Right
Every safeguard, built in from Day 1.
Row-Level Security
Supabase RLS policies enforce tenant isolation at the database level. Every query is scoped -- no application-layer filtering hacks, no hoping your code catches every edge case.
Real-Time Subscriptions
Supabase Realtime channels push data changes to connected clients the moment they happen. No polling. No stale dashboards. No refresh button.
Exportable PDF Reports
Server-side PDF generation captures your dashboard's state -- charts, tables, branding -- exactly as it appears. Trigger it on demand or on a schedule, and deliver it to an inbox or S3.
Role-Based Access Control
Granular permissions control who sees what, from admin-level overviews down to team-scoped views. It plugs into whatever auth provider you're already using.
Performance Monitoring
We profile every query and chart render during development. Slow queries get flagged before your users ever run into them.
SEO & Shareability
Public dashboards get server-rendered Open Graph previews. When someone pastes a link into Slack or email, it shows something meaningful -- not a blank card.
What We Build
Purpose-built features for your industry.
D3.js Custom Visualizations
Custom charts that go well beyond bar-and-line -- treemaps, Sankey diagrams, heatmaps, geo plots -- built around your actual data story, not whatever the library ships by default.
Recharts for Standard Components
Declarative, composable Recharts components handle the 80% of views that need clean, fast, accessible standard visualizations. D3 handles the rest.
Supabase + PostgreSQL Backend
Type-safe database queries with row-level security, real-time subscriptions, and edge functions for data transformations -- all wired together so nothing falls through the cracks.
Multi-Tenant Architecture
One codebase, isolated data views per org, team, or user. Enforced at every layer from the database to the UI.
Scheduled PDF Generation
Cron-triggered or on-demand report builds using React PDF or Puppeteer, delivered via email, webhook, or cloud storage. Branded, scheduled, automatic.
Embeddable Dashboard Widgets
iframe-ready or Web Component chart modules your customers can embed directly in their own products or internal tools -- without rebuilding anything.
Built on a Modern, Secure Stack
Our Development Process
From discovery to launch. Quality at every step.
Data Audit & Schema Design
Week 1We start by mapping your data sources, defining your metrics, and designing the PostgreSQL schema with RLS policies baked in. You get a working ERD and query plan before we touch any UI.
Wireframes & Chart Selection
Week 2Interactive Figma prototypes define every dashboard view, filter interaction, and chart type. We validate those with your ops and finance stakeholders before writing a line of code.
Frontend Build & Data Integration
Weeks 3–5Then comes the build -- Next.js app structure, D3/Recharts components, Supabase integration, real-time subscriptions. Every chart gets profiled for render performance against large datasets.
PDF Export & Access Control
Week 6After that, we layer in server-side PDF generation, RBAC, and tenant isolation testing. Security audits confirm there's no cross-tenant data leakage before anything ships.
Load Testing & Launch
Week 7–8We stress test against production-scale data volumes, deploy to Vercel edge, and monitor for 30 days post-launch -- performance tuning and bug fixes included.
Ready to discuss your your users are drowning in spreadsheets. you need a dashboard. project?
Get a free quoteFrequently Asked Questions
Explore related industries
200+ employee company? Complex multi-tenant, auction, or multi-location requirement? We have a dedicated enterprise capability track.
Get Your Dashboard Assessment
Tell us about your data -- we'll scope a dashboard and deliver a quote within 24 hours.
Let's build
something together.
Whether it's a migration, a new build, or an SEO challenge — the Social Animal team would love to hear from you.